Welcome to Source of Knowledge (SOK), a series where I share a variety of materials to help you grow in the fields of UI/UX and BI. While preparing this series, I saw it as a great opportunity to read some classics I’ve never had time for. This pilot post features the well-known book “Storytelling with Data,” which I first read after 13 years of experience in the field, and I found it still very insightful.
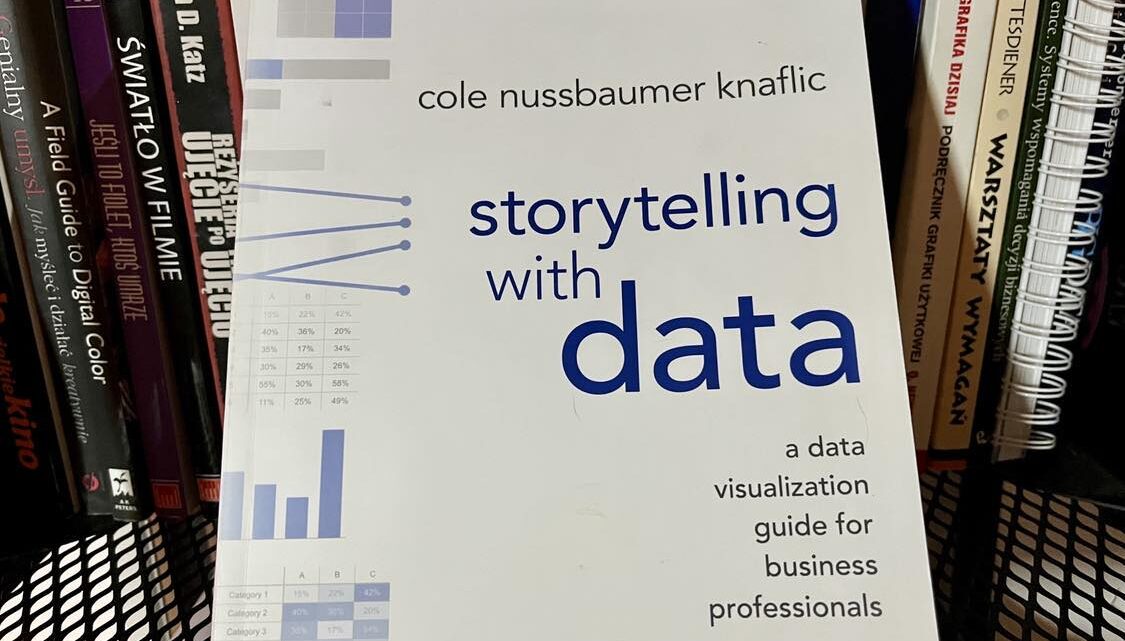
“Storytelling with Data” by Cole Nussbaumer Knaflic
Published in 2015, “Storytelling with Data” is a handy A5 format book with a soft cover, perfect for those who prefer physical books over digital ones. It’s easy to read, with a decent amount of content per page, and is written in a non-academic language. Despite being almost a decade old, the book remains relevant. The concept of storytelling with data takes the regular optimization of data visualizations even further. Instead of just ensuring it serves the data in the easiest way to digest, it focuses on emphasising key insight(s) coming from it.
Why you should read “Storytelling with Data”?
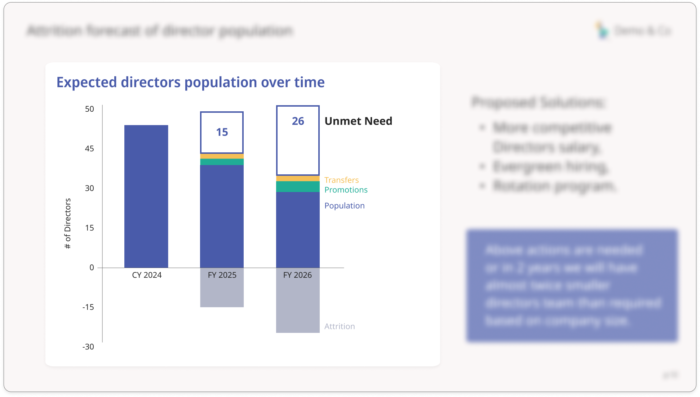
The key takeaway from the book is a set of techniques for visually explaining decisions to be made, surfacing relevant information, and emphasizing data points that lead to specific conclusions. One example that stood out to me was a visualization showing the attrition of directors in a company. It was altered in such a way that the audience couldn’t ignore the gap between the required and current number of directors. To illustrate its impact without infringing copyrights, I’ve recreated a similar chart below in context of PPT slide:

The data labels were shown only for the items related to director-level missing in the organization. In the original example, many details were subtly altered to affect perception and reading patterns. The book explains precisely these design decisions and their expected audience reception. The number of examples is more than satisfying, and until the last three chapters, you will rarely see the same example revisited to unveil new techniques.
Content review of”Storytelling with Data”.
The book is well-planned and kept me intrigued enough to maintain a steady reading pace. The chapters cover almost all aspects of data visualizations and storytelling in logical and easy-to-comprehend chunks. Here is the Table of Contents:
- the importance of context
- choosing an effective visual
- clutter is your enemy
- focus your audience’s attention
- think like a designer
- dissecting model visuals
- lessons in storytelling
- pulling it all together
- case studies
- final thoughts
The first five chapters form the core of the book, providing general concepts without delving into every detail of each topic. One great aspect of the book is that the author frequently recommends other books to explore specific fields further. Some of these titles I’ve read and would also recommend regarding each topic.
Chapters 6, 8, and 9 were challenging for me as they focus on case studies, sometimes covering all elements learned from the book. Chapter 9 was the most intriguing, exploring cases not covered in the core chapters. Chapter 7 is a bit of a mystery. It’s interesting and much different from the others, exploring theories on storytelling, stories structure (in deferent form), and techniques to make it engaging. However, it felt more like a scriptwriting class, which could be summarized in two pages for data visualizations context.
I suggest switching the order of chapters 7 and 8 for better coherence. Maybe this reversed learning experience will help you grasp the benefits of storytelling theories that can be applied to data visualizations more quickly.
Final Thoughts on “Storytelling with data.” as a book
and visualization concept.
I highly recommend the book as it succinctly encapsulates many aspects of my work, particularly the impact of visual attributes on the audience’s reception of data. It provides numerous additional reference points, ensuring you are not left without guidance after reading but rather set on a well-defined learning path.
The only aspect I’m uncertain about is whether all the knowledge and methodology can be applied in the BI industry context.
Even the author differentiates types of analysis, stating that this book focuses on explanatory rather than exploratory analysis.
BI tools I know focus on exploratory/discovery analysis. While manually designing and developing a storytelling dashboard is feasible, doing this daily would require hiring a designated “data bard” for each department to prepare data-oriented stories.
AI will help in this, but it raises the question: are we moving away from exploratory analysis at all and will relying solely on AI-generated business data excerpts? It might actually be quite efficient, like hiring a super-wise expert who completes the analysis in matter of seconds and delivers a set of next-step recommendations along with data visualization justifications.
